Concept mapping as a creative tool
Posted 02 Nov 2012 / 2 If your brain is anything like mine, thoughts pretty much constantly race across it. As I consume media — especially media designed to inform — these thoughts intensify. As I read or listen or watch, my brain makes rapid connections between the new ideas I can recognize in the media I am consuming and the old ideas that I have held in my mind. Sometimes the ‘new ideas’ are not new at all, as they complement existing ideas that seem to have taken up permanent residency in my head: when I watch an object fall in a movie, my brain takes scant notice of this idea as it simply confirms the very well-established idea that gravity compels objects to fall. But some ideas are truly new, so novel that they compel the existing ideas that I carry around in my head to move over, reconfigure themselves, or even disappear. It is as if all these ideas interact in a diverse community, housed in my head, and the arrival of new ideas has the potential to reconfigure that community.
No one knows where knowledge and understanding are stored in our heads. Although the basic function of the neurons that make up our brain are well understood and neuroscientists have an impressive array of technologies that can scan our brains at work, no one has cracked the code of the human brain. Why? Well, because the brain is an incredibly complex network of interconnections, and we are not very good at understanding complex networks. So as we try to figure out how to make the best use of the brains we have, we will have to make some guesses as to how they work. Although admittedly the physical structure of the brain may not serve as an apt metaphor for how it actually works, it is reasonable to guess that what we call ‘knowledge’ and ‘understanding’ boils down to how different ideas are connected in our heads. In other words, we seem to house a huge ‘map’ of ideas in our mind, and learning is the process of adding ideas to this map or finding new connections between ideas already on the map.
When I sit down and think about something, I can travel the byways of this map. At least for me, thinking flows a little like topics in a conversation: in my mind I can travel from idea to idea along the connections in the map, just as a long conversation can lead from topic to topic (sometimes so much so that we pause and ask “how did we get onto this topic?”). Looking at a particular idea, I can see where it is ‘located’ relative to a few nearby ideas, but what I really want access to is the whole map. Some particularly brilliant people seem to have the ability to access their entire map of ideas: these are the kinds of people who can rattle off a long, well-organized presentation on a topic without notes or other forms of planning. But for the rest of us, how do we access the maps of understanding that reside in our heads? What is the best way to organize what we know so that we can express this understanding in some form to others?
Writing is one way to access what we understand. Often when I sit down to write, I can allow the understanding in my head to flow ‘onto the page’ in a way that I might not have been able to do if I simply began speaking. But what if I am not sure what I want to write, or if I do not know how to organize the ideas I want to write about? And what if I do not want to write at all? What if the creative work I want to do has to represent understanding in a medium other than words? Over many years of being a student, teacher, and researcher, I have become a big advocate of concept mapping as the best way to organize one’s thoughts and plan how to express understanding. Concept mapping (also sometimes called “mind mapping”) is a deceptively simple-yet-powerful way of representing ideas and their inter-relationships graphically.
In this post I am going to walk you through the process of creating a concept map that will aid in achieving the goal of expressing understanding via visual media. I will not be actually creating this visual media, but I will prepare myself to do so by building a concept map. I will be building this concept map using the Visual Understanding Environment (VUE), a free open-source software platform for making concept maps. Although you certainly can make a concept map using good old paper-and-pencil, as I will show you there are some major advantages to using a program such as VUE. You can download VUE for free here. So that we are both working from the same base material, I am going to be constructing my concept map using the following TED talk by David Gallo as my inspiration:
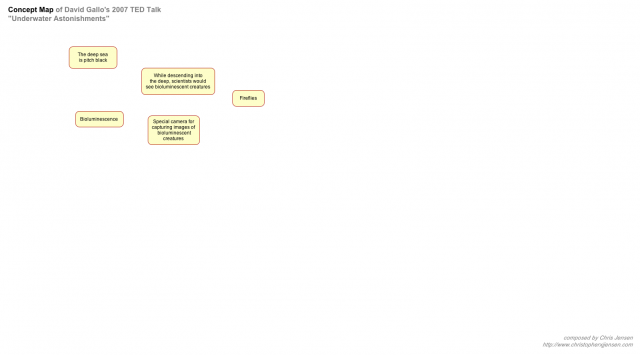
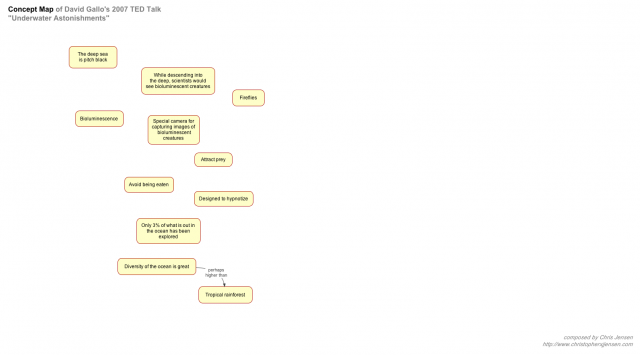
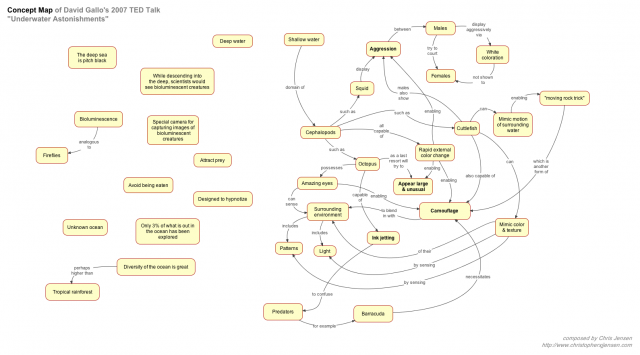
It is a good idea to watch this talk before reading the instructions below, but you can also just play sections of it and pause as you go. I am going to start with what I call Stage 1 of creating a concept map, which is to read, listen to, and/or watch your source media and begin to map out the information and ideas expressed in my source(s). To keep this map simple I am going to rely on only this one source (also accessible as David Gallo’s TED Talk on “Underwater Astonishments”), but this kind of map could easily be made with multiple sources. As I take in the information provided by my source, I am going to record this information as ‘nodes’ on a developing map. Below, you can see the early stages of this based on the first minute of this talk (you should be able to click on all of the concept map images below to see them enlarged):
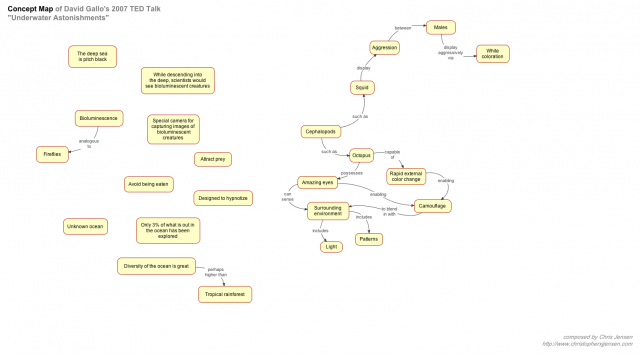
In general, the goal is to create a map with fewer intersecting connectors; although some connectors are going to have to cross others, if you have a lot of criss-crossing connectors that probably indicates that you need to rearrange your nodes. This is one of the big advantages of concept mapping over outlining or other forms of sketching out your ideas: because space and proximity are flexible in a map, experimentation with the spatial structure of your map can help build understanding, as nodes with more connections are going to end up closer to each other as you try to keep your map tidy. Ideas that are central will have to end up being placed centrally, and peripheral ideas will have to be placed peripherally: otherwise, you map will be a big mess. I generally spend a fair amount of time reconfiguring the geography of my maps, and this is time well spent because this spatial rearrangement clarifies my understanding of how different nodes relate to each other. Looking at the map above, you can see that there are two major weaknesses:
- On the left side, there are very few connections between nodes and each node is described in many words (suggesting that my nodes should be broken up into more pieces); and
- There is little connection between the left and right sides of my map.
Perhaps I have not fully captured all the interconnected ideas expressed by Gallo (feel free to check my work!), but that was the goal of Stage 1 of concept mapping.
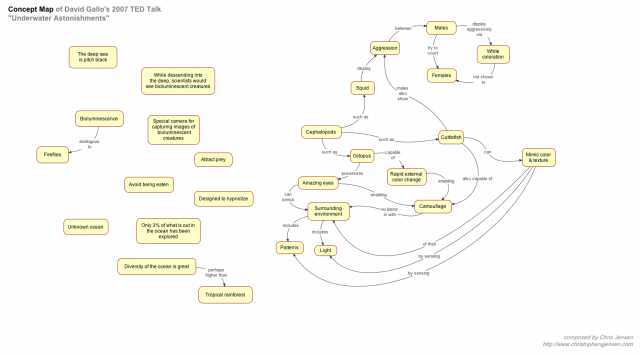
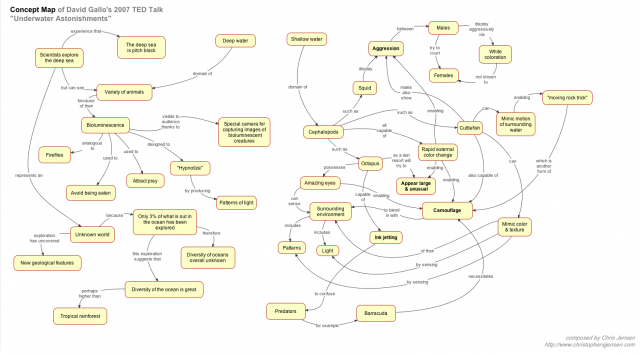
Stage 2 is where I insert my own ideas.What do I know about that can connect to what Gallo has presented? What additional meaning can I make from his foundation of ideas? To distinguish between what I interpreted from his work and what I came up with on my own, I will switch to a new color for both nodes and connectors. After a bit of work, my map looks like this:
A major goal of Stage 2 concept mapping is bringing together the material presented in my sources. If my sources are particular coherent in what they present, I may not have much work to do at this stage. But if I am using a variety of sources and/or if these sources are less than conceptually-clear, I may have my work cut out for me. Working with my Stage 1 representation of David Gallo’s talk, you can see that I had a fair amount of work to do to create my own meaning using the ideas that he presented. The talk certainly had some underlying themes and ideas, but they were not explicitly laid out in the talk (but let us cut David Gallo some slack, as he had only five and a half minutes to present what mostly were meant to be awe-inspiring images to the notoriously dazzle-hungry TED audience).In my Stage 2 work, I tried to bring out the elements of this talk that were meaningful for me, because in the end my goal is to express some of these ideas in my own creative work. You will also notice that while I kept all the same connections between the nodes that I included from the Gallo talk, these had to be significantly reshuffled in order to make sense in my new map. Again, the value of an editable concept map is particularly invaluable: just the fact that you can move nodes around in VUE without losing their connectors is really useful. What you often end up with when you move nodes around is a ‘knot’ of connectors, but such a knot can be untangled. Contrast this effort with what it would take to re-draw the whole thing with pencil and paper.
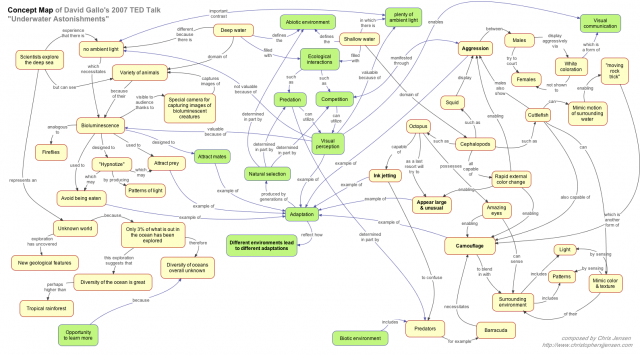
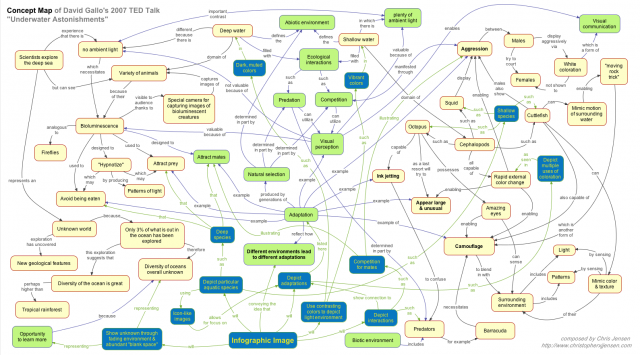
The final step of concept mapping in order to plan my creative work is Stage 3, where I will include ‘design elements’ on my map. In my case, I am planning on creating an infographic that will depict the effect of environment on aquatic adaptations, so my design elements will reflect the way I want to create this infographic. Below is an image of my final map with these design elements included, again in a new color:
Notice how my Stage 3 design nodes are integrated into my Stage 1 and Stage 2 nodes, which again required some rearrangement of the map. I have provided some pretty basic nodes for my design elements (which may reflect my rather weak design skills when it comes to making infographics!), but of course you could make your design elements more detailed. If you would like to scroll through the entire progression, you can click on the gallery below:You can also download the finished map as a PDF and as a VUE file.
This post was originally designed to help students working on creative Final Projects in my Great Adventures in Evolution course. But if you find this to be a helpful guide, let me know by posting a comment below or contacting me. Enjoy!
A Major Post, Art & Design, Concept Mapping, Lesson Ideas, MSCI-160, Great Adventures in Evolution, Neuroscience, Pratt Institute


 I am getting very excited for the City Nature




It is realy a very good article which has assisted me to design my own concept maps to be used in teaching and learning.